

Eli Ben-Sasson, Zcash co-founder and CEO of blockchain tech company Starkware, says he “feels on track” to a $5,000 end-of-year price target for Zcash (ZEC). His previous prediction of ZEC trading beyond $1,200 by September 25, 2026 is now a success, as it trades at around $1,549 at the time.
While the tripling valuation forecast is ambitious, several developments show why there is a chance it just might happen.
Zcash on the road to $5,000
For one, investment firm 21Shares recently launched Europe’s first Zcash exchange-traded product (ETP). At around the same time, Grayscale’s Zcash ETF (ZCSH) officially surpassed $915 million in assets exactly a month after launch, signalling high institutional demand.
Moreover, ZEC has rallied primarily due to its privacy architecture. As institutional uptake increases, so does the need for confidential but compliant blockchain transactions.

For these reasons, ZEC has outperformed Bitcoin (BTC) by 14x since the latter’s all-time high. The next best-performing altcoins after it are HYPE, XMR, and NEAR, which outdid BTC by 2-3x. According to Glassnode, this performance makes ZEC the best of the 9 altcoins (in the top 50 by market cap) that have outperformed BTC.
What the technical analysis shows
On the weekly chart, the real-time Relative Strength Indicator (RSI) and its moving average are both rising. This, in addition to the macro Golden Cross confirmation in early August and a positive MACD histogram, signals strong bullish acceleration.
That said, the weekly RSI has recently pushed into the overbought territory at 77.14. While still bullish, those who purchase ZEC right now risk local pullbacks.
A similar conclusion can be drawn from the 200-week Simple Moving Average (SMA). This indicator has curved sharply upward and now hovers around $150. Comparing this with ZEC’s current price shows entry into a full-scale bull market.
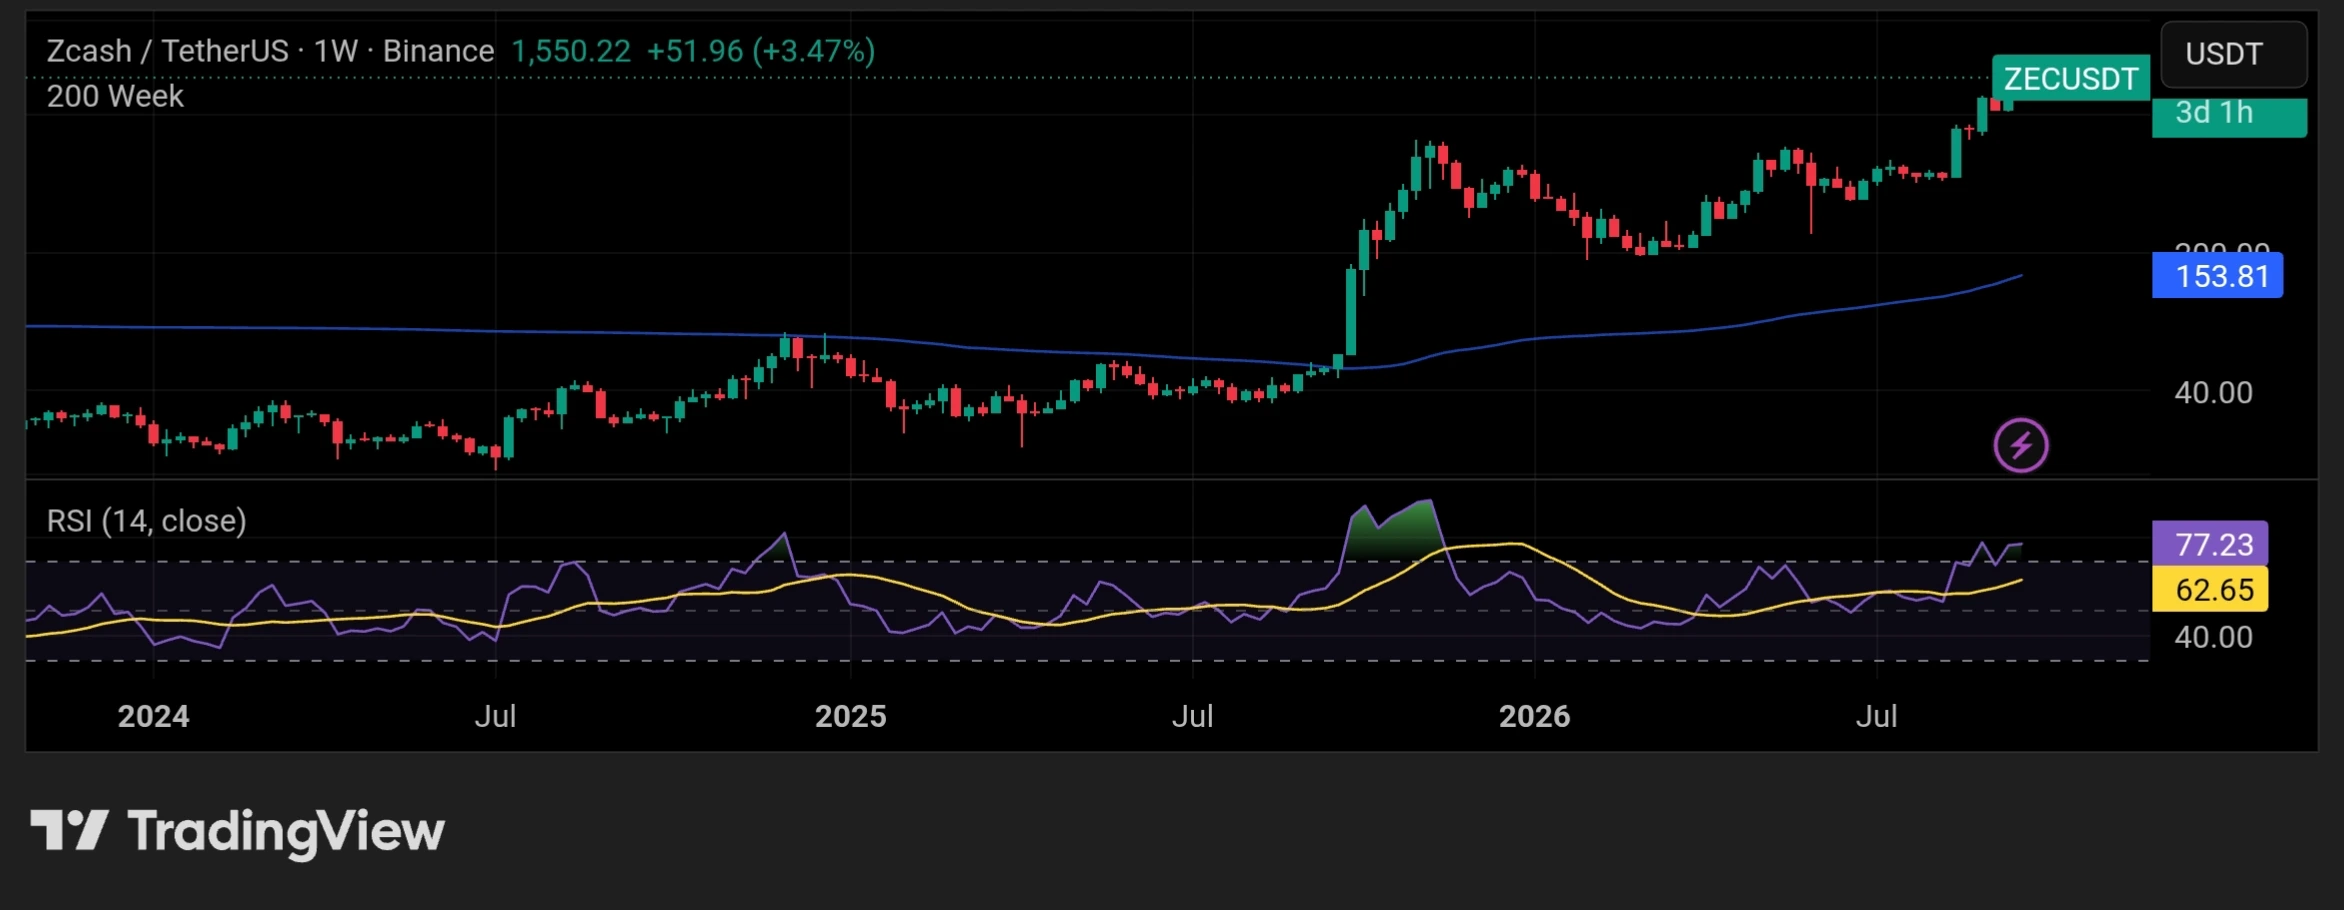
However, the colossal difference between the 200-week SMA and the digital asset’s current price shows an overextension of the macro trend.
In the near term, ZEC is eyeing a retest near its recent high of $1,650. A break below the $1,440 support would have the way for a downtrend to $1,310.
Community take
Polymarket users have a somewhat balanced wager, betting a 55% chance that ZEC trades beyond $2,000 this year.
Was this writing helpful?
Story Ends Here
Trust with CoinPedia:
Investment Disclaimer:
All opinions and insights shared represent the author’s own views on current market conditions. Please do your own research before making investment decisions. Neither the writer nor the publication assumes responsibility for your financial choices.
Sponsored and Advertisements:
Sponsored content and affiliate links may appear on our site. Advertisements are marked clearly, and our editorial content remains entirely independent from our ad partners.
Read the Next News